Monitor Stats
Monitor your container’s resource usage in real-time from the Stats tab.
Opening Stats
- Go to Containers and click on a container
- Click the Stats tab
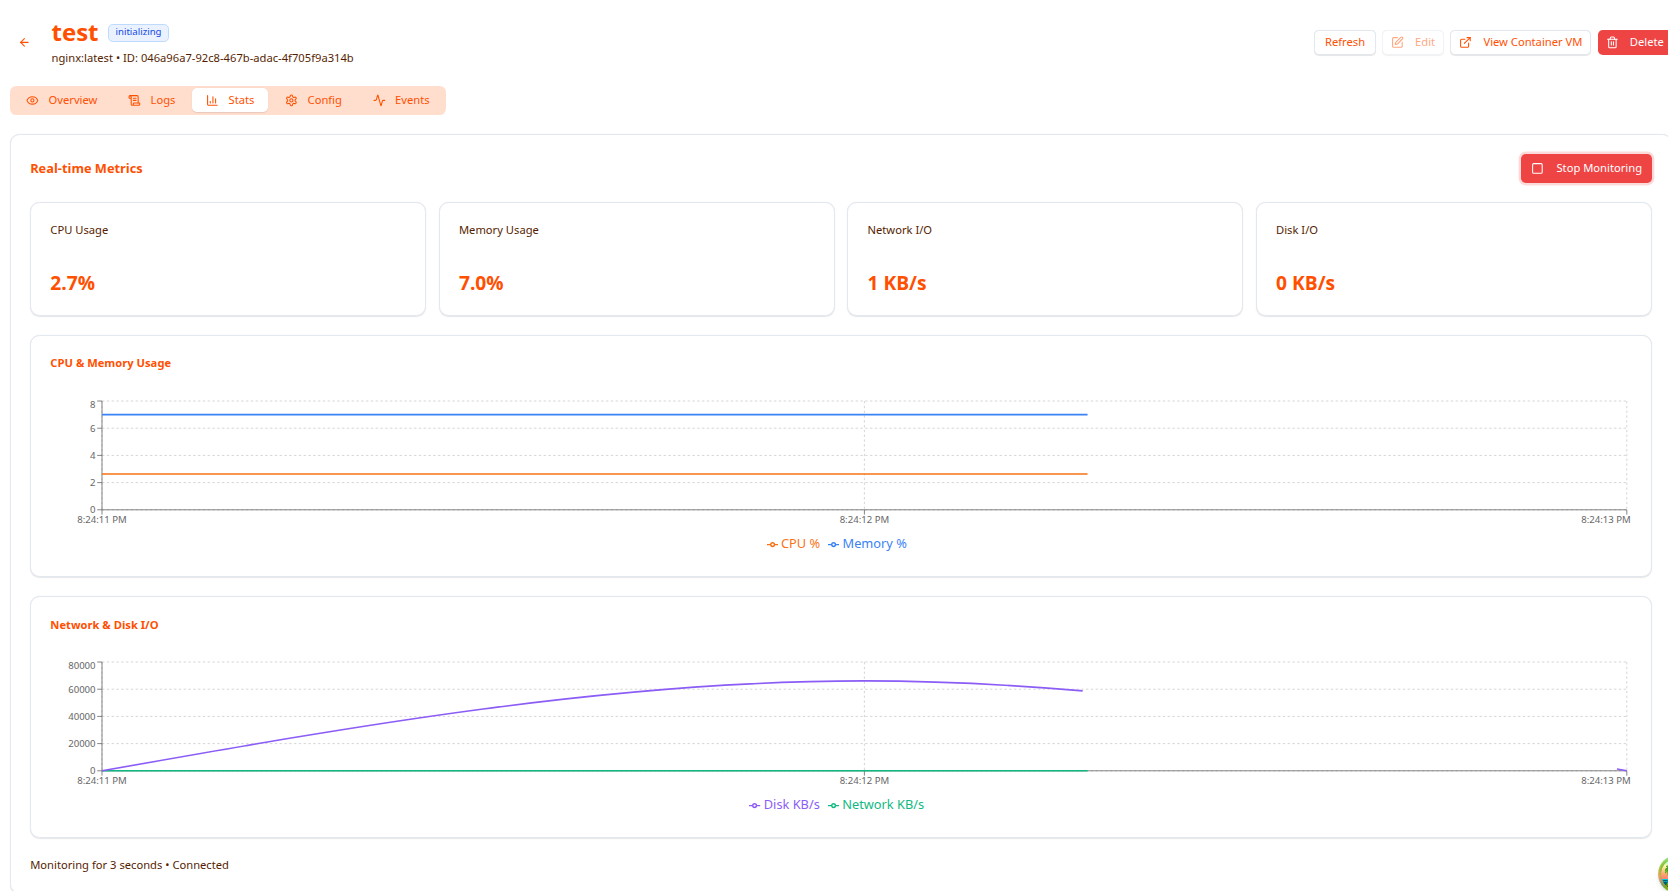
Stats stream live as long as the container is running. The status bar at the bottom shows “Monitoring for X seconds • Connected”.
Use the Refresh button in the top-right header to manually reload, or Stop Monitoring to pause the live stream.
Metric Summary Cards
Four live counters update continuously at the top of the page:
| Card | What it shows |
|---|---|
| CPU Usage | Current CPU utilization as a percentage |
| Memory Usage | Current RAM utilization as a percentage |
| Network I/O | Combined inbound + outbound throughput in KB/s |
| Disk I/O | Combined read + write throughput in KB/s |
Charts
CPU & Memory Usage
A time-series line chart plots CPU % (orange) and Memory % (blue) over a rolling window. Use this to spot sustained high usage, spikes, or a slowly climbing memory line (possible leak).
Network & Disk I/O
A second chart plots Disk KB/s (purple) and Network KB/s (green). Useful for identifying bursts of disk or network activity — for example during container startup, a large file operation, or a spike in inbound traffic.
Header Actions
From the container detail header you can:
- Refresh — force-reload the page
- Edit — change container settings
- View Container VM — jump to the underlying VM that runs this container
- Delete — remove the container
Performance Analysis
CPU too high (>90%)
- Increase CPU allocation: stop → Edit → increase vCPU → start
- Profile the application and optimize hot paths
- Check if a cron job or GC cycle is causing the spike — look at the Logs tab at the same timestamp
Memory climbing steadily
A gradual upward slope on the memory line is a sign of a memory leak. Short-term fix: restart the container. Long-term fix: profile the application to find the leak.
Large Disk I/O spike at startup
Normal — the container runtime pulls layers and initializes storage. Disk I/O should flatten out once the container is fully running.
Network I/O unexpectedly high
Check the Logs tab for errors or retry storms. High outbound with low inbound can indicate a container sending data it shouldn’t.
Troubleshooting
Stats not showing / charts empty
- Confirm the container state is Running (stats are only available for running containers)
- Click Refresh in the header
- Click View Container VM to verify the underlying VM is also running
Metrics frozen / not updating
- Switch to the tab if it’s in the background (browsers throttle inactive tabs)
- Refresh the page
- Check your network connection
Memory always at 100% but container is stable
Some applications (Redis, Memcached) intentionally use all allocated memory as a cache — this is expected. Check Logs for OOM errors to confirm it’s not a problem.
Next Steps
- View Logs — Debug issues identified in stats
- Manage Containers — Adjust resources based on stats
- Deploy a Container — Apply allocation lessons learned