On this page
Monitoring
Monitor your VM’s real-time performance from the Metrics tab on the VM detail page.
Opening the Metrics Tab
- Go to Virtual Machines and click any running VM
- Click the Metrics tab in the top navigation
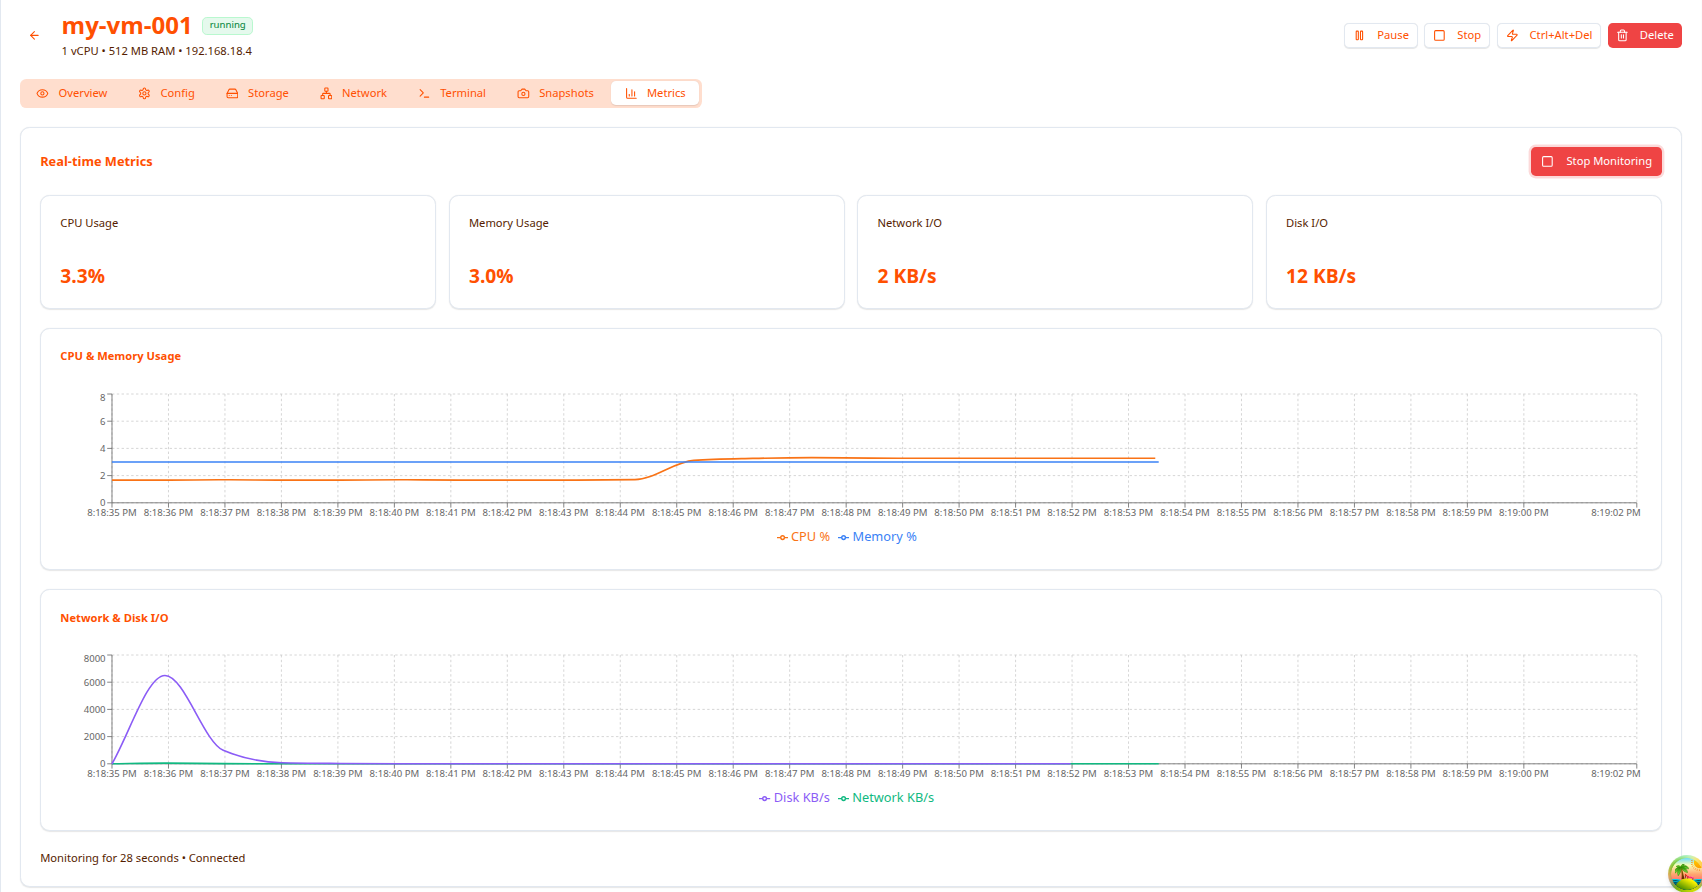
The dashboard starts streaming live data immediately. The status bar at the bottom shows “Monitoring for X seconds • Connected” confirming the WebSocket connection is active.
Metric Summary Cards
At the top you’ll find four live counters that update every second:
| Card | What it shows |
|---|---|
| CPU Usage | Current CPU utilization as a percentage |
| Memory Usage | Current RAM utilization as a percentage |
| Network I/O | Combined inbound + outbound throughput in KB/s |
| Disk I/O | Combined read + write throughput in KB/s |
Charts
CPU & Memory Usage
A time-series line chart plotting CPU % (orange) and Memory % (blue) over a rolling time window. Use this to spot spikes, sustained high usage, or memory leaks over time.
Network & Disk I/O
A second chart plots Disk KB/s (purple) and Network KB/s (green). Useful for identifying bursts of disk or network activity — for example a large file transfer or database write.
Starting and Stopping Monitoring
- Monitoring starts automatically when you open the Metrics tab.
- Click Stop Monitoring (top right) to pause the live stream.
- Navigating away from the tab disconnects the stream automatically.
Next Steps
- Backup & Snapshot — Protect your VM data
- Manage VM — Start, stop, pause operations